Subscribers & analytics
Read the Quiz performance table on Home
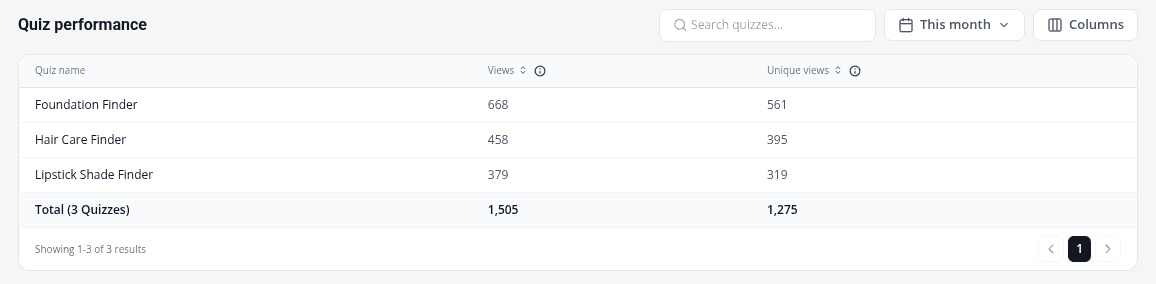
Compare all your quizzes on the Home page: views, submissions, subscribers, carts, orders, revenue and products sold.
3 min read·Updated October 20, 2026·All plans
In the appSalesQ/Home/Quiz performance
In this guide
- 01Compare all your quizzes in one table
- 02Search, pick dates and choose columns
- 03Sort quizzes by any figure
- 04Open one quiz's detailed analytics
Before you start
- –A published quiz on your store. See Publish your quiz on your store.
The Quiz performance table on Home gives you a quick side-by-side view of every quiz. It's available on every plan and is the fastest way to see which quiz is doing the most for your store.
The tiles at the top of Home
Above the table, three tiles show this month's Sessions, Subscribers and Emails, each with your plan's limit underneath, or Unlimited where your plan has no limit. Your quiz responses for the month are shown on the Plans page. See What happens when you reach a plan limit.
Find and adjust the table
- 1
Open Home
Click Home in the app menu and scroll to Quiz performance.
- 2
Search
Type in Search quizzes… to show only the quizzes whose names match.
- 3
Pick a date range
The table shows This month by default. Open the date menu to choose another preset, or Custom for your own dates, then click Save. Click the X icon to clear the dates.
- 4
Choose columns
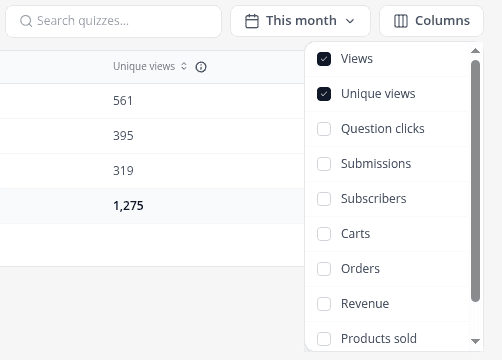
Click Columns and tick the figures you want to see. Views and Unique views are on to start with; you can add Question clicks, Submissions, Subscribers, Carts, Orders, Revenue, Products sold and Device split. Your choice is remembered in this browser.
- 5
Sort
Click a column heading to sort the quizzes by that figure. Click again to reverse the order.
What the columns mean
| Column | What it counts |
|---|---|
| Views | Every time the quiz loaded, including repeat visits. |
| Unique views | Distinct visitors who loaded the quiz. |
| Question clicks | How many times shoppers clicked an answer. |
| Submissions | Shoppers who answered to the end and reached a result. |
| Subscribers | Contacts captured by the quiz's email or phone step. |
| Carts | Shopping carts linked to the quiz. |
| Orders | Paid Shopify orders credited to the quiz. |
| Revenue | The total of those orders. |
| Products sold | The best-selling product from the quiz, plus how many others sold. |
| Device split | How the quiz's loads divide between desktop, mobile and tablet. |
The bottom row adds up all quizzes. The table shows 5 quizzes per page.
See one quiz in detail
Click a quiz name to open its own analytics page, with a daily timeline, the products it sold and every response. See Per-quiz analytics and responses.
If you haven't built a quiz yet, the table shows No quiz yet! with a Build first quiz button. See Create your first quiz.
Learn more
Related articles
- Per-quiz analyticsOpen one quiz's analytics to see its views, submissions, revenue and products sold, read each response and export them as a CSV file.→
- Analytics overviewWhat each tab on the Analytics page shows, from quiz views and submissions to email engagement, automations and your subscriber base.→
- Revenue attributionHow AISalesQ decides which orders and revenue to credit to a quiz, and where you'll see those numbers in the app.→
Was this page helpful?
Still need help?
Can't find what you need? Talk to the people who build the app.